pghealth is an agentless PostgreSQL health check tool that helps teams detect performance issues, hidden risks, and inefficiencies before they turn into incidents.
By combining automated diagnostics with intelligent analysis, pghealth provides a clear, prioritized view of your database health — without requiring complex monitoring setups.
A PostgreSQL health check is a structured analysis of your database system to evaluate performance, stability, and potential risks.
It goes beyond simple monitoring by identifying underlying issues such as:
A proper PostgreSQL health check tool helps teams understand not just what is happening, but why it is happening.
Most production issues do not start as incidents — they build up over time:
By the time alerts trigger, performance is already impacted.
Traditional monitoring tools expose metrics, but they rarely explain what actually needs attention.
An automated PostgreSQL health check allows teams to detect these risks early and take action before users are affected.
A reliable PostgreSQL health check tool should detect the most critical issues affecting production systems:
These are the root causes behind most PostgreSQL performance problems.
pghealth is built specifically for PostgreSQL and focuses on actionable insights rather than raw metrics.
Key capabilities include:
Unlike generic monitoring platforms, pghealth acts as a dedicated PostgreSQL health monitoring tool designed to highlight what actually matters.
pghealth connects to your PostgreSQL instance and analyzes system statistics using built-in views and performance data.
The process includes:
This approach transforms raw data into a clear and actionable health assessment.
Feature | Manual Scripts | Traditional Monitoring | pghealth |
|---|---|---|---|
| Setup | Time-consuming | Complex setup | Agentless and simple |
| Insights | PostgreSQL-specific | Generic metrics | PostgreSQL-specific insights |
| Prioritization | None | Alert noise | Health scoring |
| Approach | Reactive | Infrastructure-focused | Database-focused |
| Scalability | Hard to scale | Medium | High |
pghealth can also be used as a lightweight alternative to traditional PostgreSQL monitoring tools when fast, actionable insights are needed.
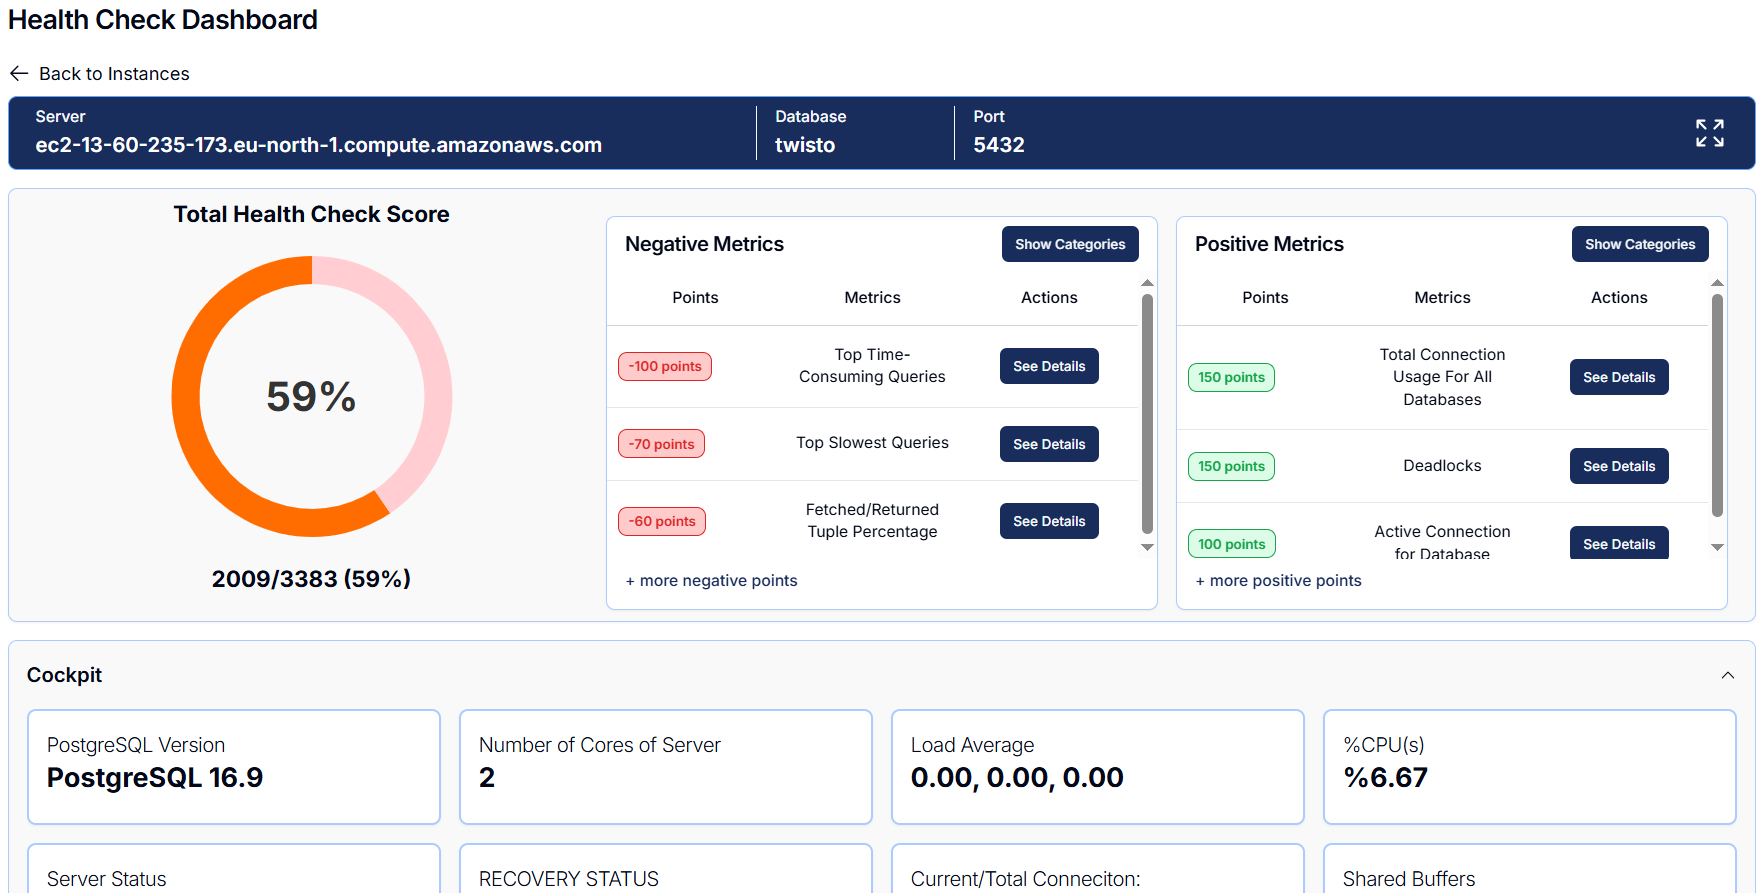
One of the biggest challenges in PostgreSQL monitoring is prioritization.
pghealth aggregates multiple signals into a single health score, allowing teams to quickly assess the overall condition of their database.
Instead of treating every metric equally, issues are ranked based on their impact on performance and stability.
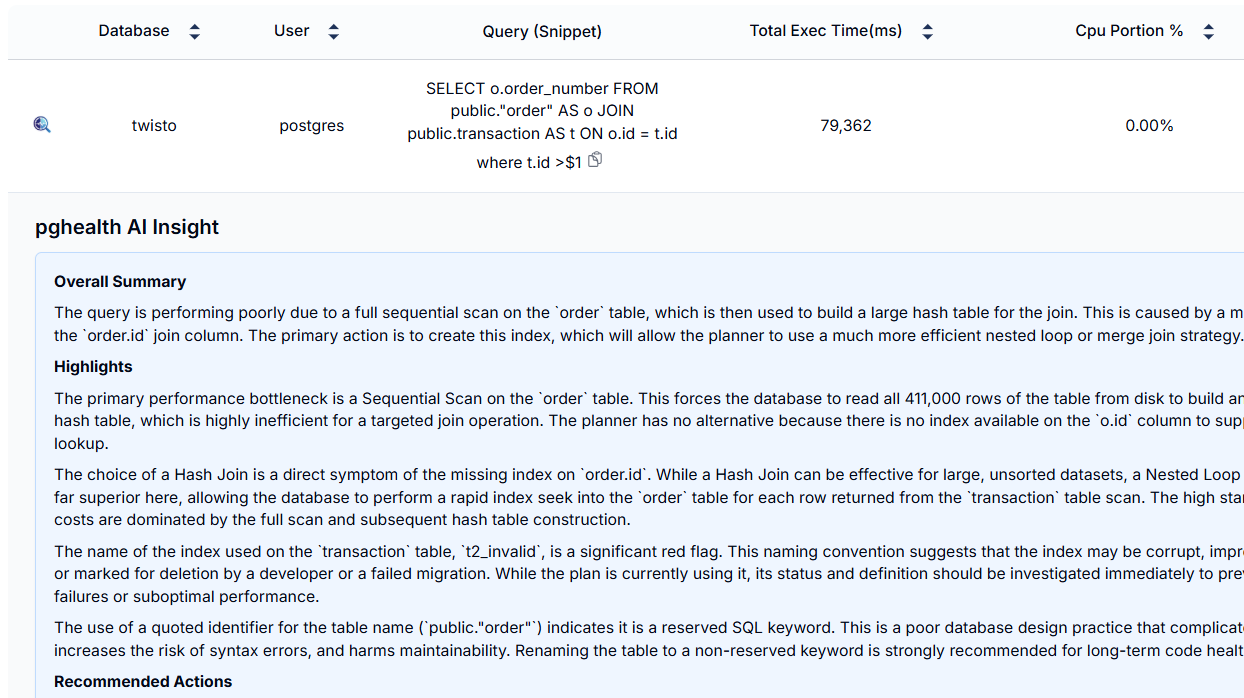
Query performance is often the primary source of database issues.
pghealth analyzes query behavior to identify:
Rather than just listing slow queries, pghealth explains why they are slow and what actions to take.
Health checks are most valuable when performed continuously.
pghealth enables teams to:
This turns a PostgreSQL health check into an ongoing operational practice.
pghealth is designed for teams running PostgreSQL in production:
It is recommended to run health checks regularly (daily or weekly) depending on system size and workload.
pghealth is designed to be lightweight and safe for production systems, with minimal overhead.
Typical checks include replication, query performance, bloat, vacuum activity, connections, and configuration analysis.
Not now, it will support very soon.
Connecting your PostgreSQL database takes only a few minutes and does not require installing agents.
Start analyzing your database health and detecting issues before they impact production.
pghealth currently supports self-managed PostgreSQL environments with full analysis capabilities.
Support for managed PostgreSQL services such as AWS RDS and Aurora is currently in development.
